Build a cash timeline
you can explain.
Turn a monthly revenue and cost baseline into a cash timeline, then test what happens when the assumptions change.
Read the worked example ↗Six months · Inspectable inputs · CSV templateCash flow planning, scenario analysis and the assumptions that connect a chart to a real decision.
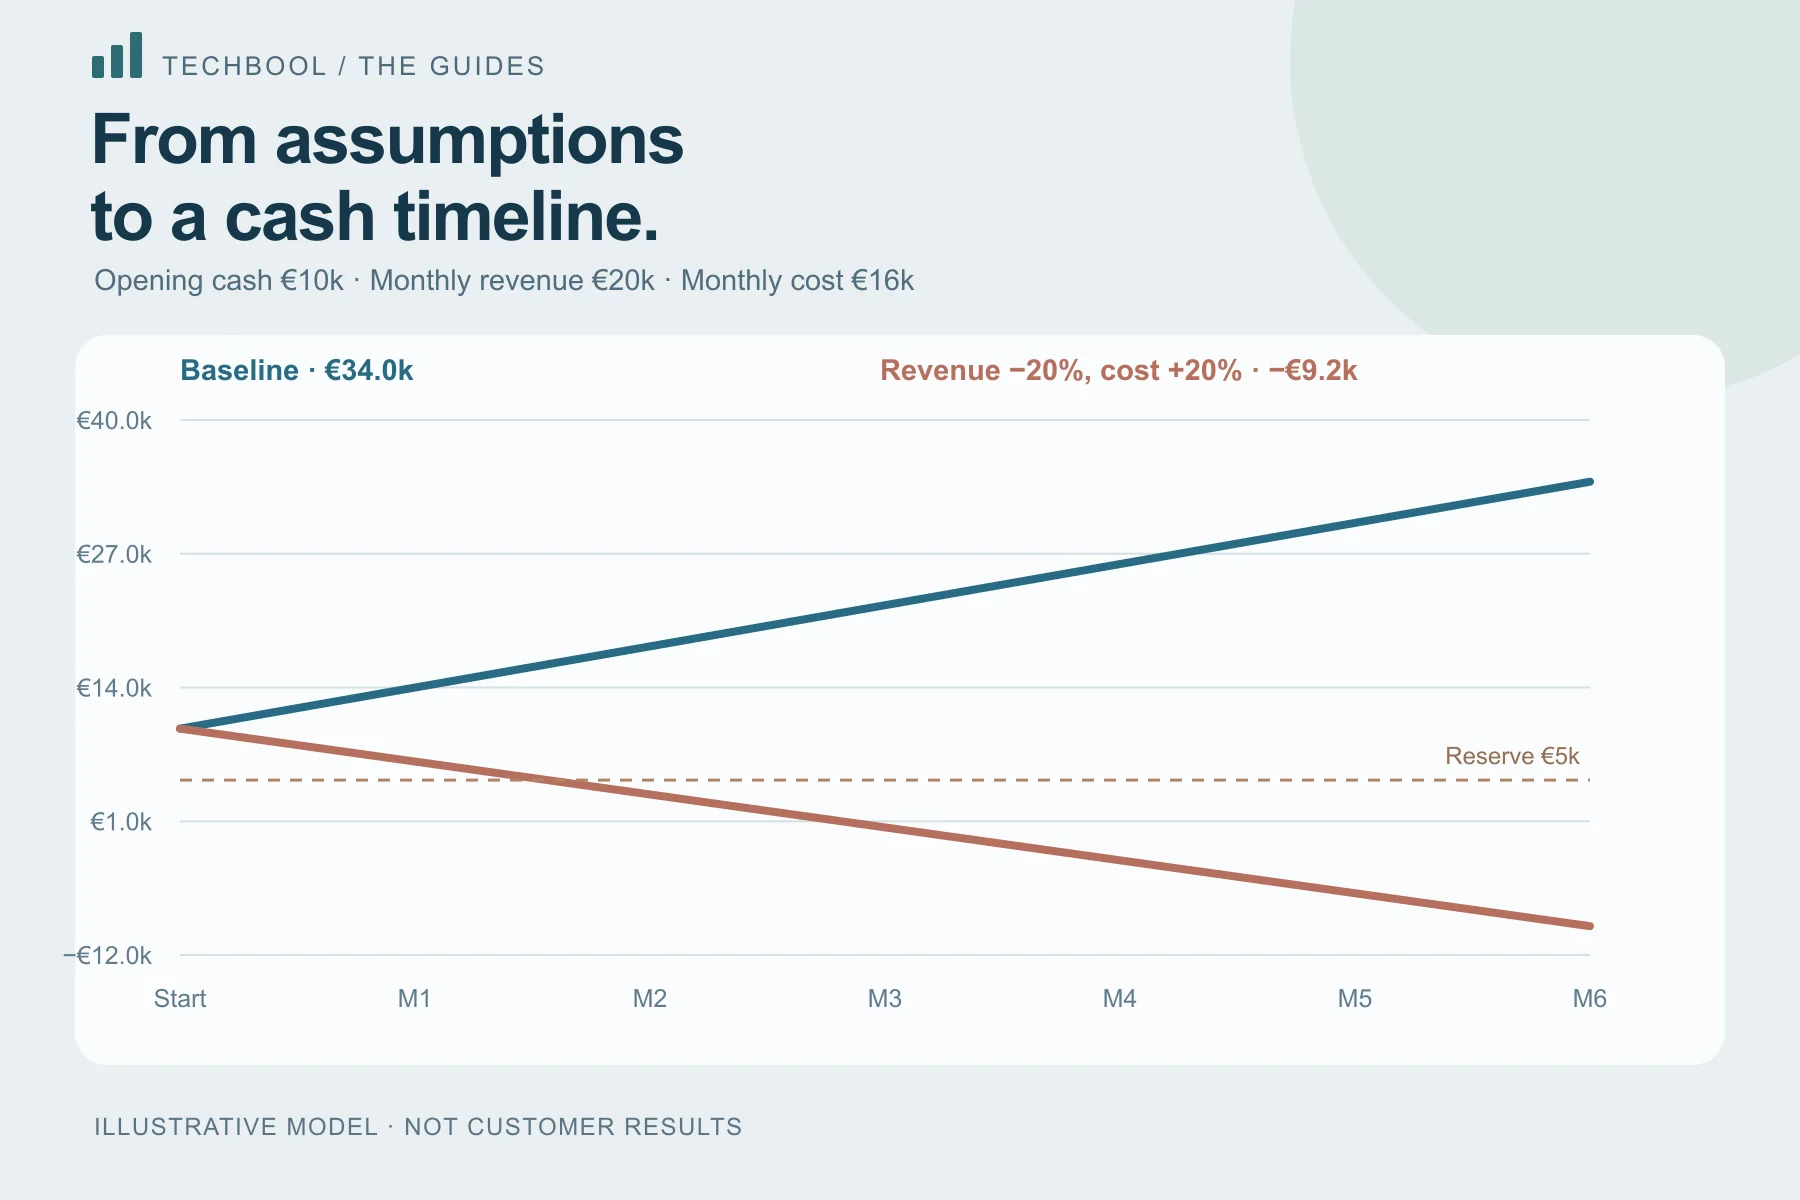
Turn a monthly revenue and cost baseline into a cash timeline, then test what happens when the assumptions change.
Read the worked example ↗Six months · Inspectable inputs · CSV templateEach guide tackles a different problem. Numerical examples are illustrative calculations, not customer results.
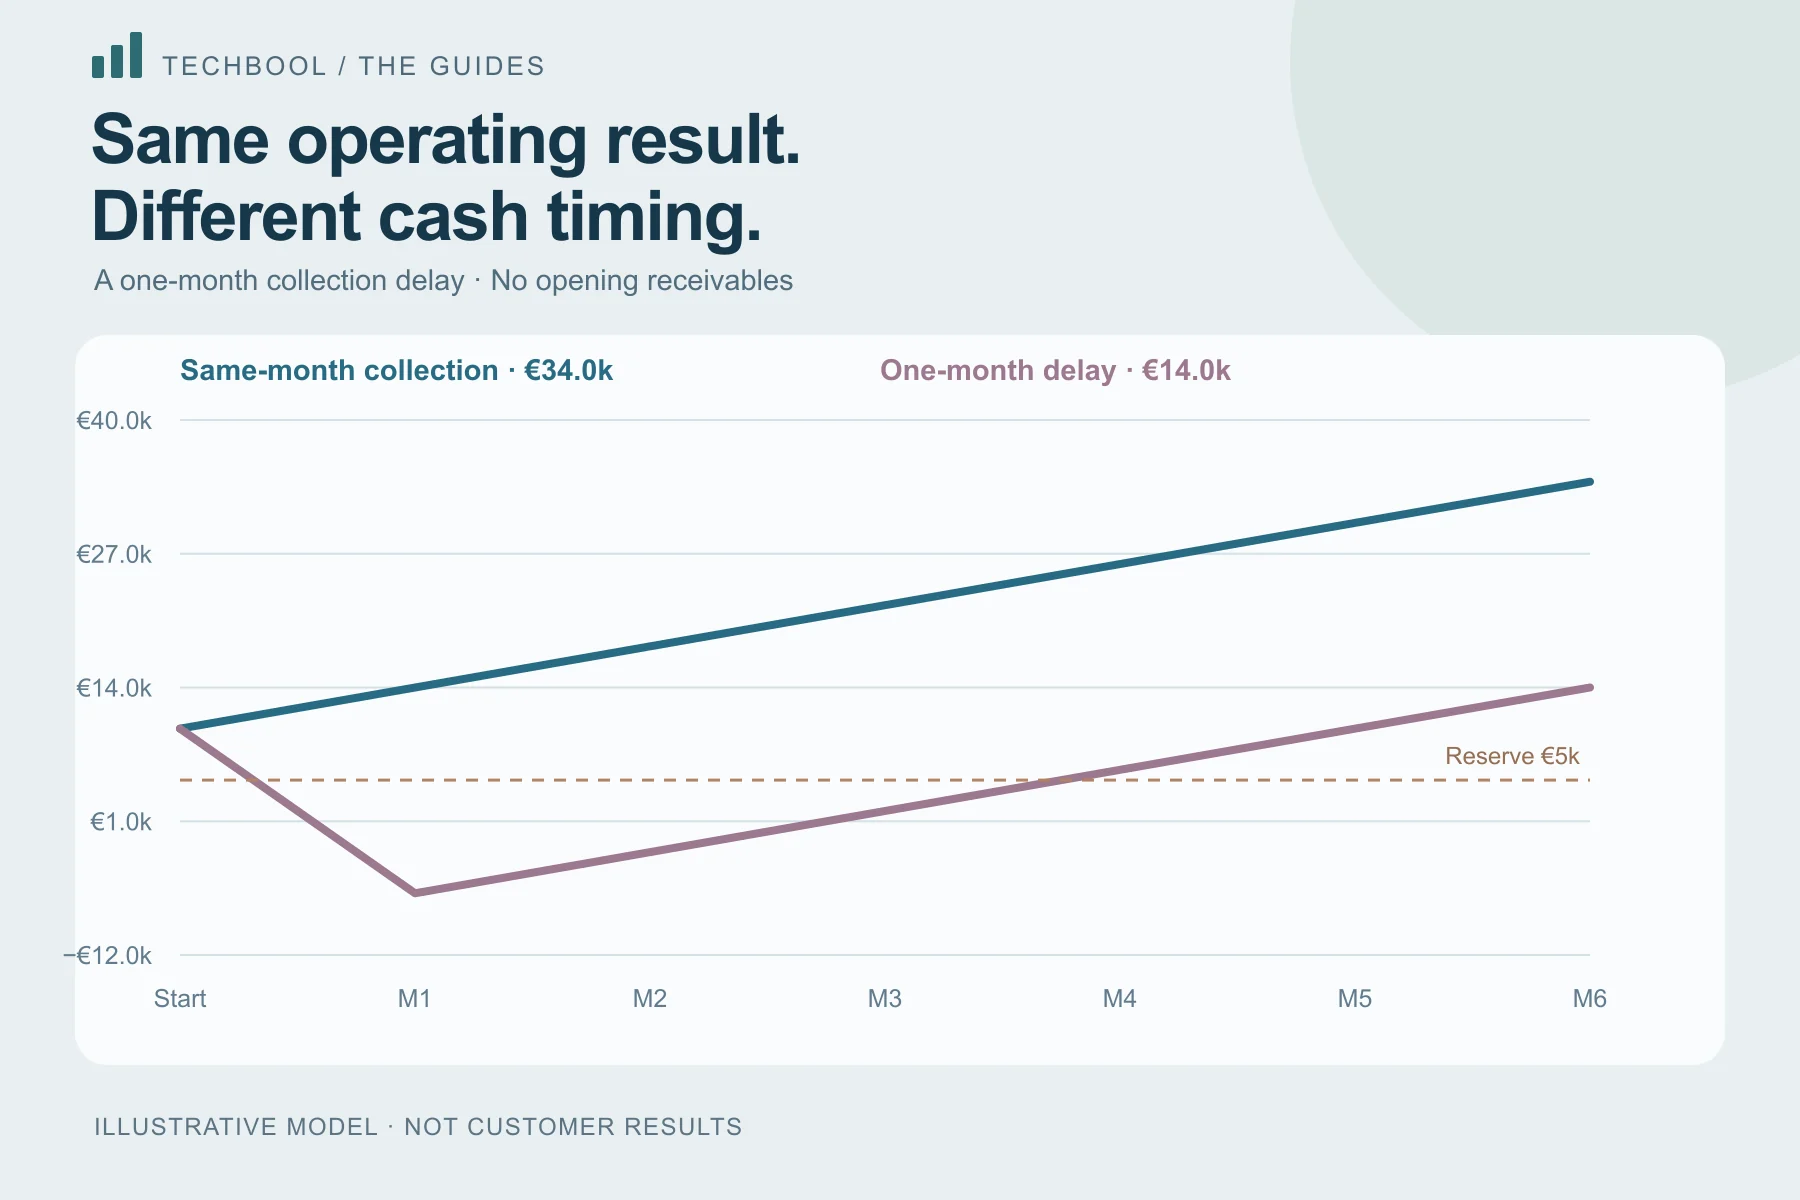
The same revenue and cost numbers produce different cash balances when customers pay later. Here is the mechanism, month by month.
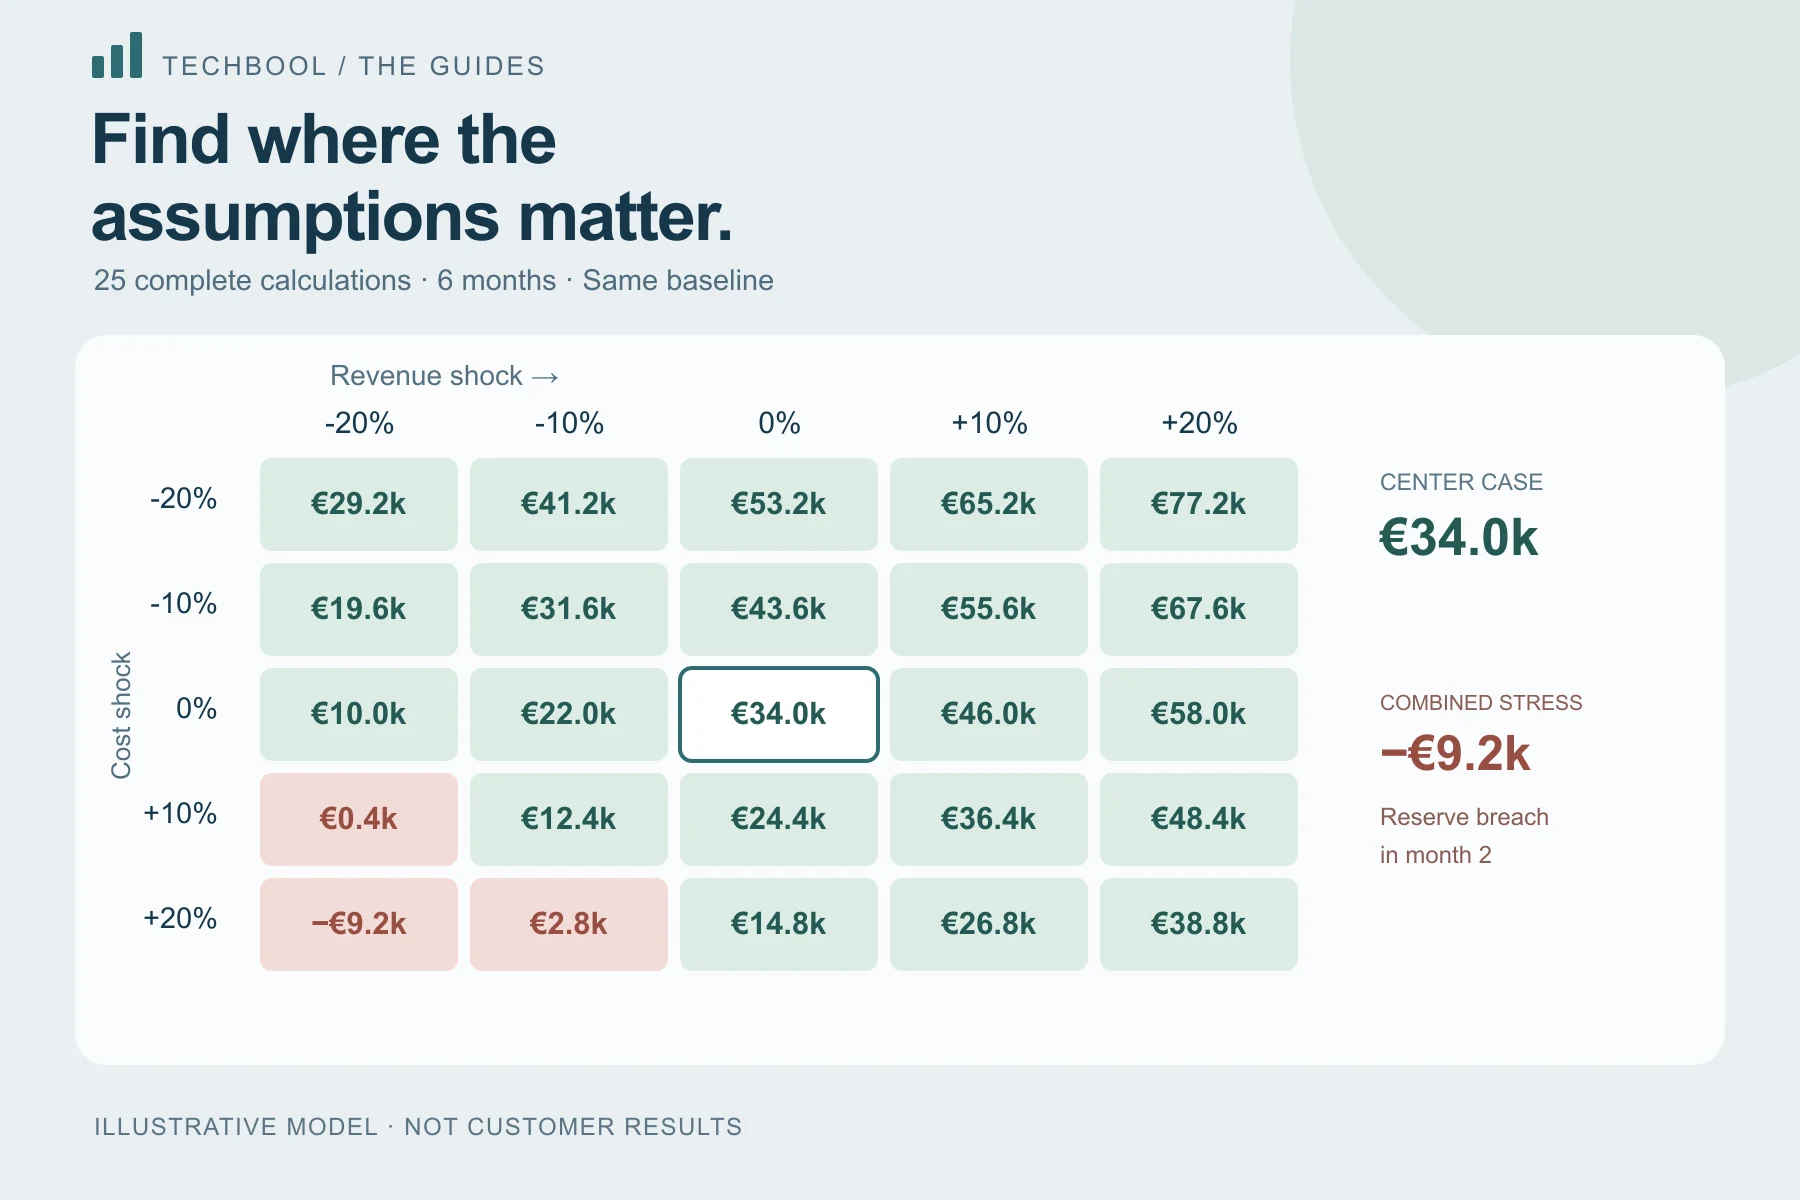
Read a 25-cell revenue and cost matrix without confusing a reserve breach, an ending balance and a probability.
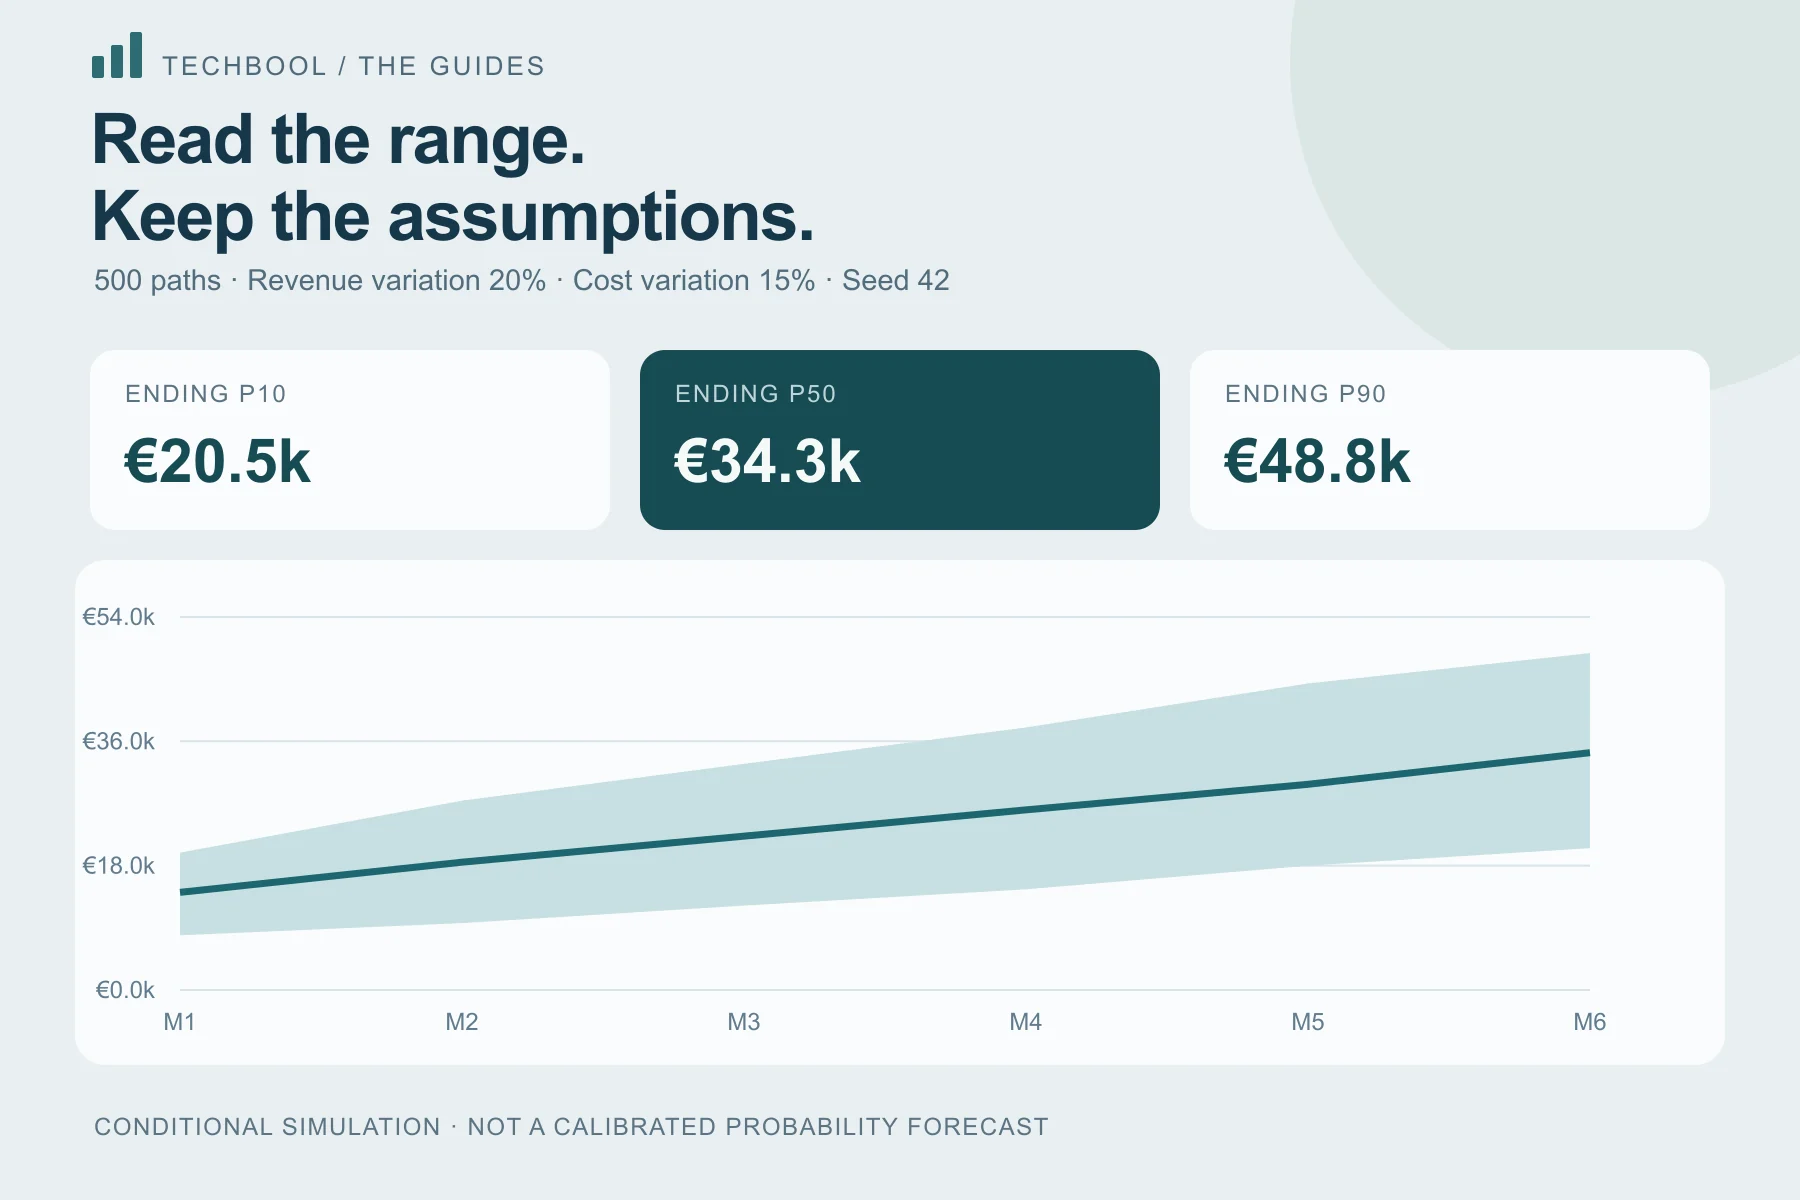
A simulation produces a conditional range. Understand its inputs and percentile bands before treating it as a forecast.
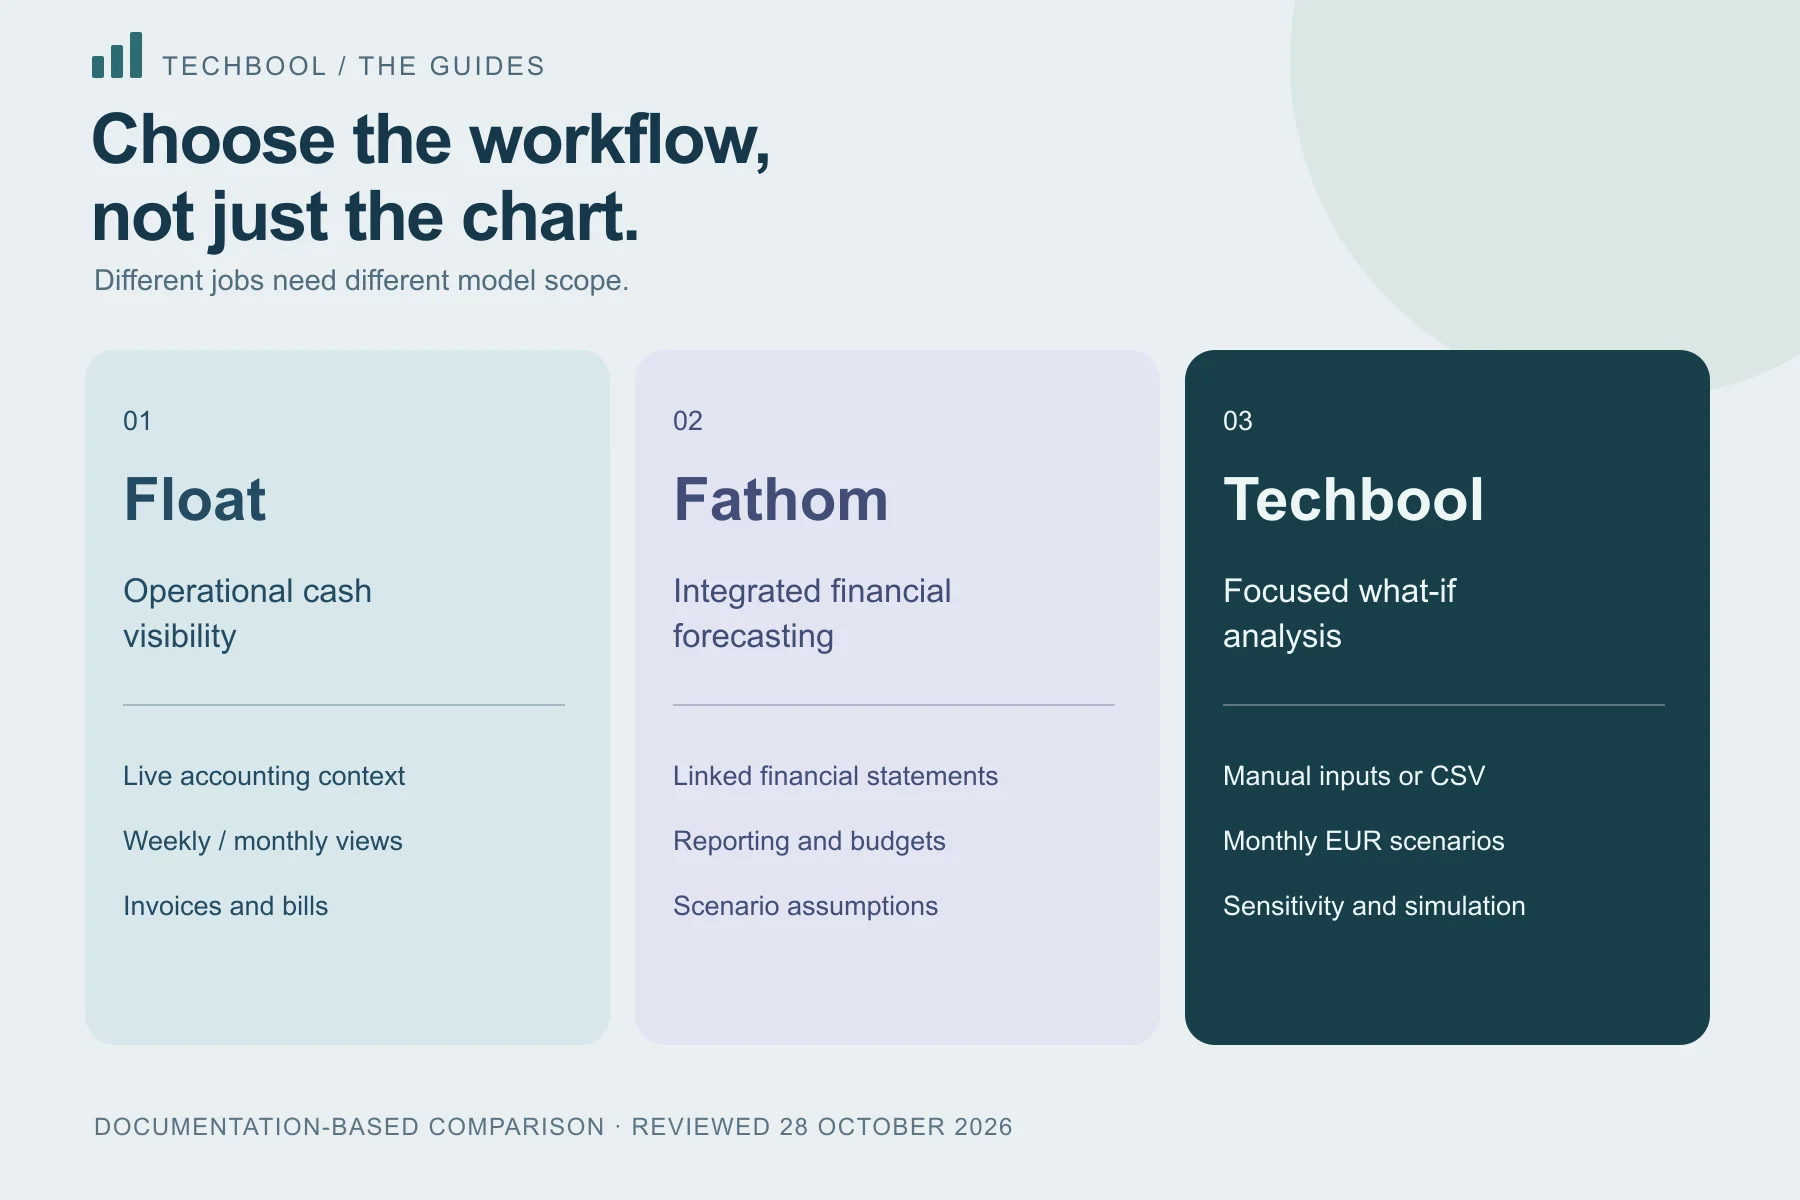
Operational cash visibility, integrated financial forecasts and focused what-if analysis solve different jobs. Compare the workflow you actually need.
Published by Techbool. Worked examples are checked against our calculation engine. Comparisons use linked provider documentation, with explicit limits on what we have verified. We do not publish invented customer outcomes.
About Techbool and these guides ↗